Hear Their Voices
August 2019 - #VizforSocialGood
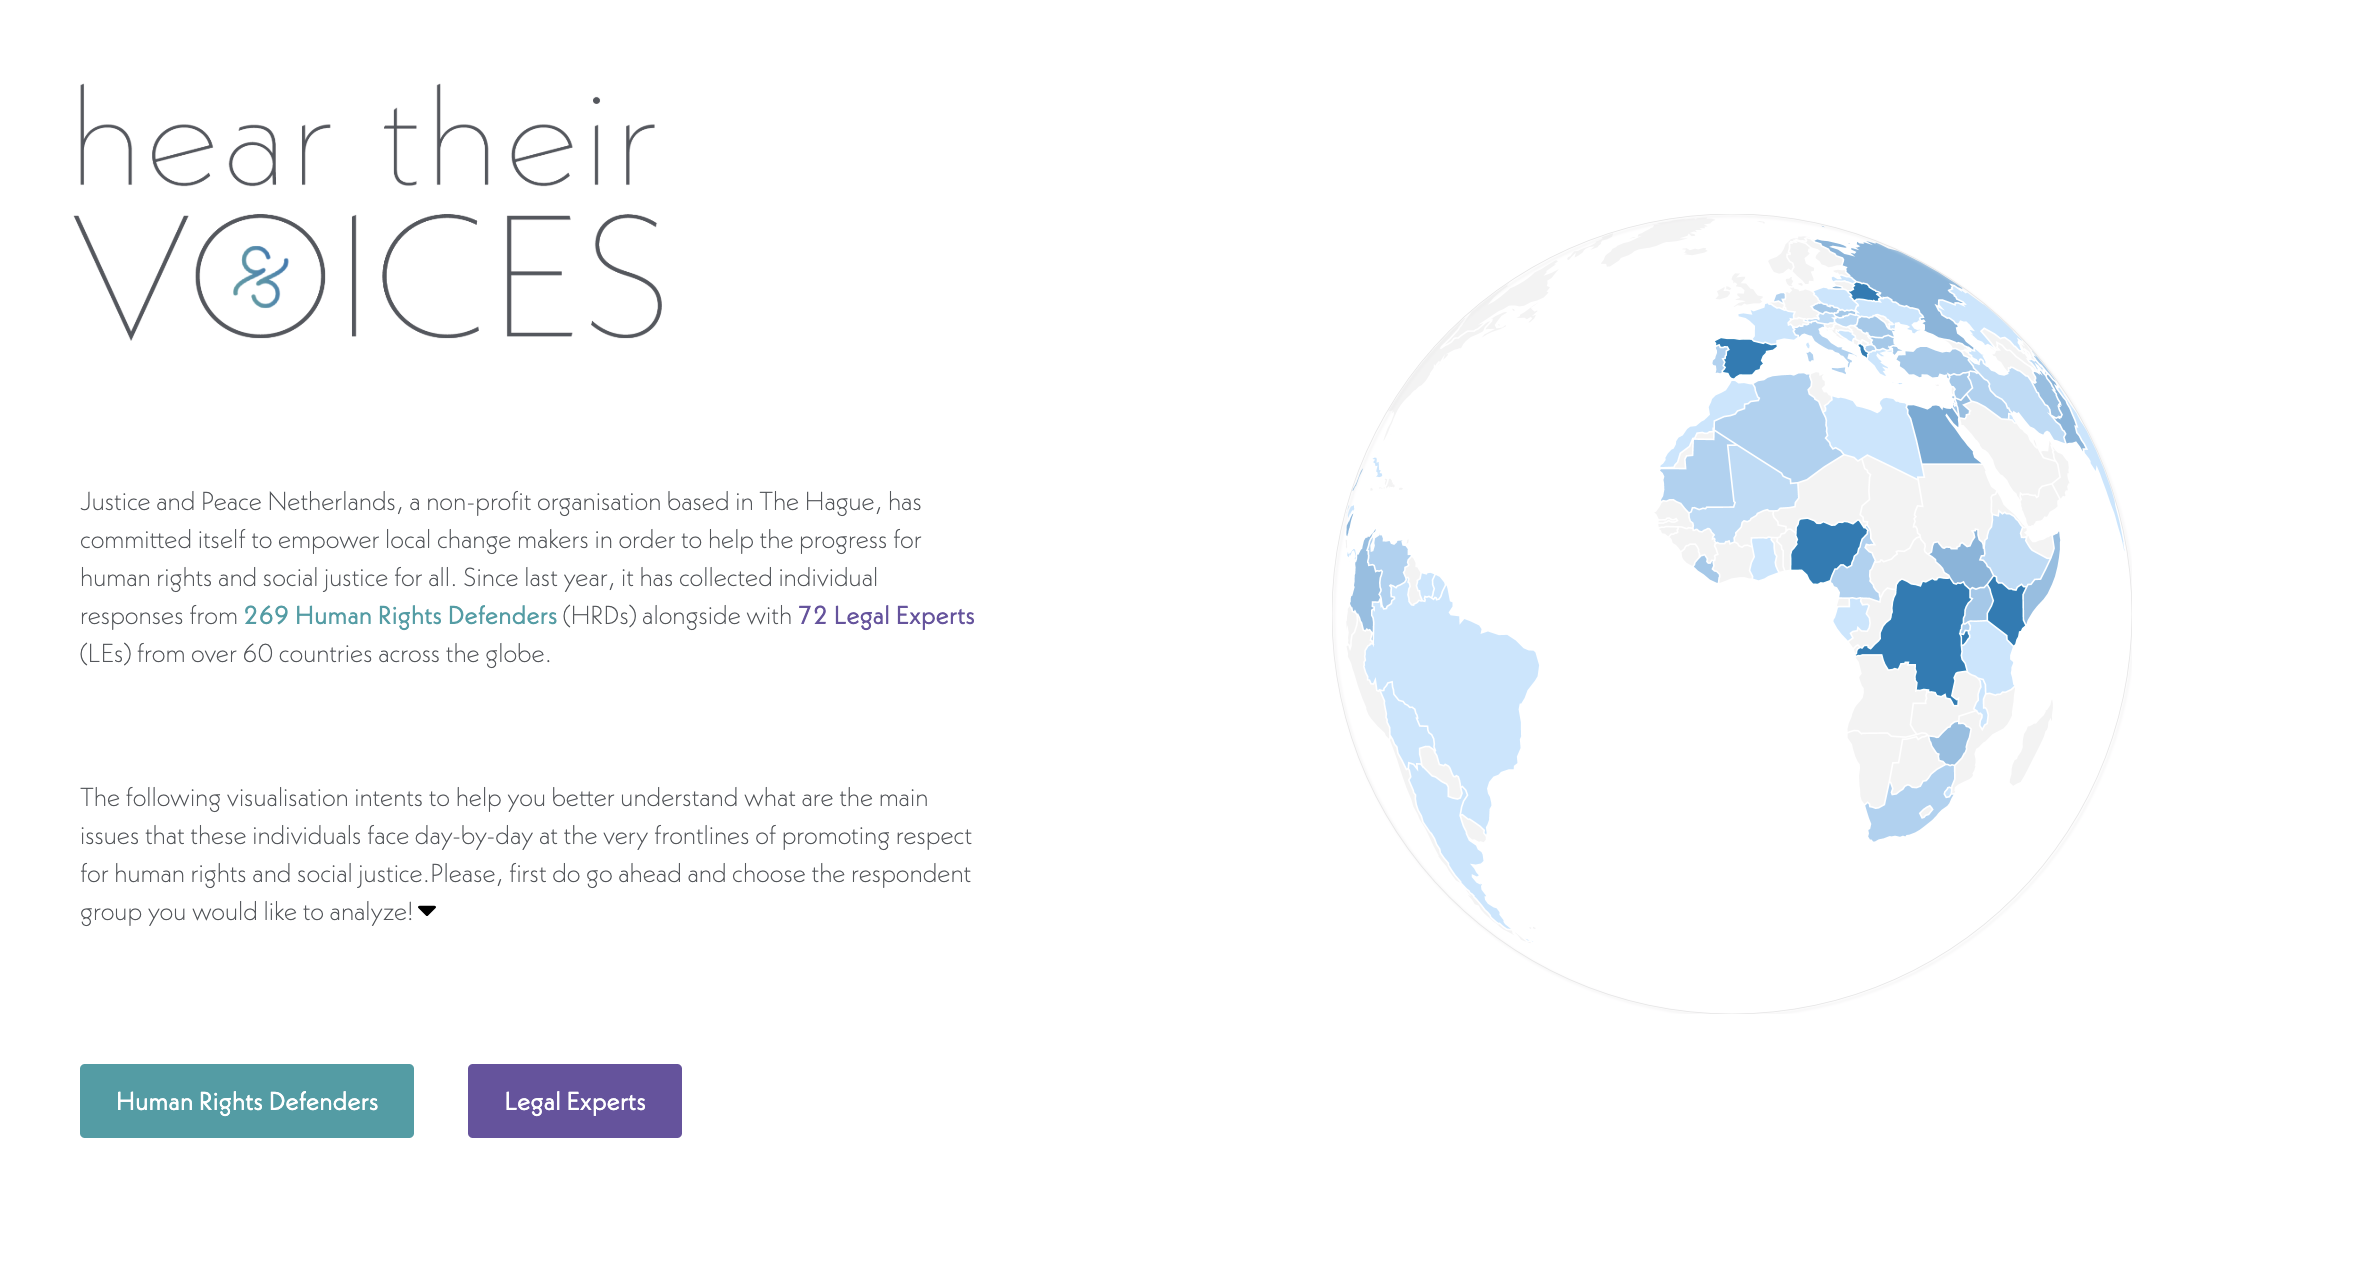
A tool that intents to help decision makers better understand and easier to cross-analyze the various challenges that local Human Rights Defenders and Legal Experts face in many countries around the globe.
Chart types
Horizontal Stacked Bar Chart,
Choropleth Map
Libraries
d3,
React,
React BeautifulDnD,
Ant Design,
Reactour
Data sources
Justice and Peace Netherlands

Global Peace Gap
June 2019 - #dataforacause
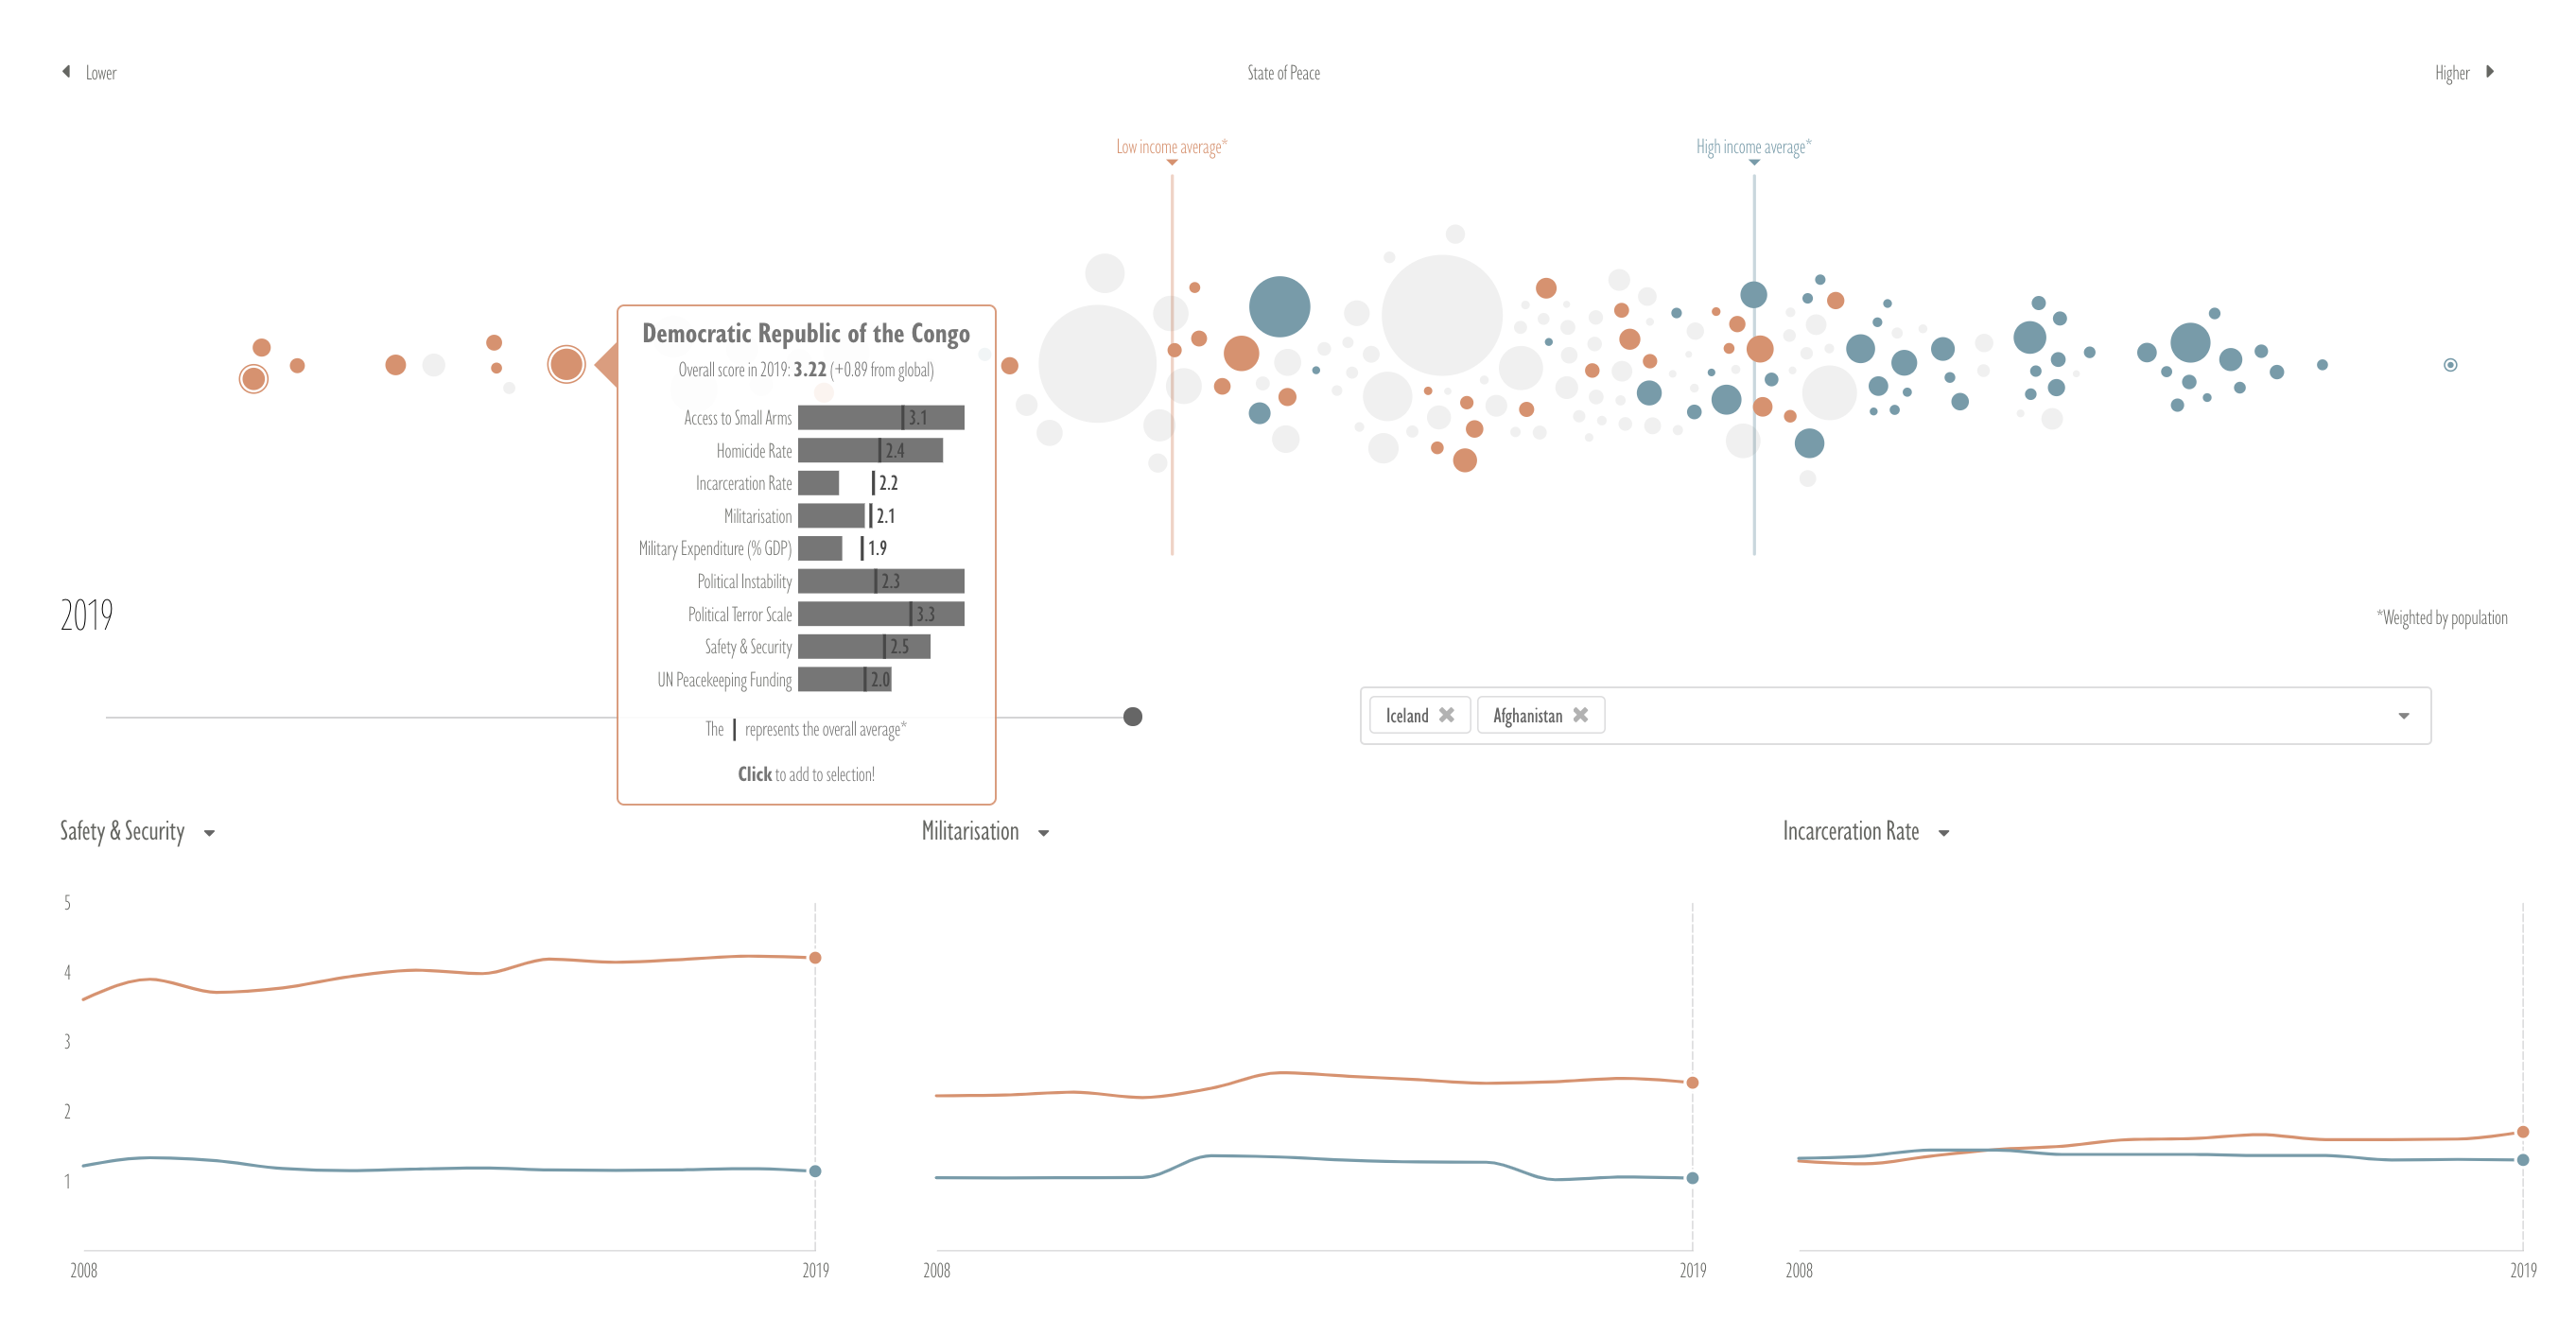
Result of my participation in #dataforacause's 2019 June challenge initiated by Olga Tsubiks to visualise the dataset on Global Peace Index produced and provided by the Institute for Economics and Peace.
Chart types
Beeswarm plot,
Barchart in tooltip,
Multiple line chart
Libraries
d3.js,
React,
Semantic UI React,
ReactTour
Data sources
Institute for Economics and Peace,
World Bank

They Gave Color to Our History
April 2019 - #boringbarchart
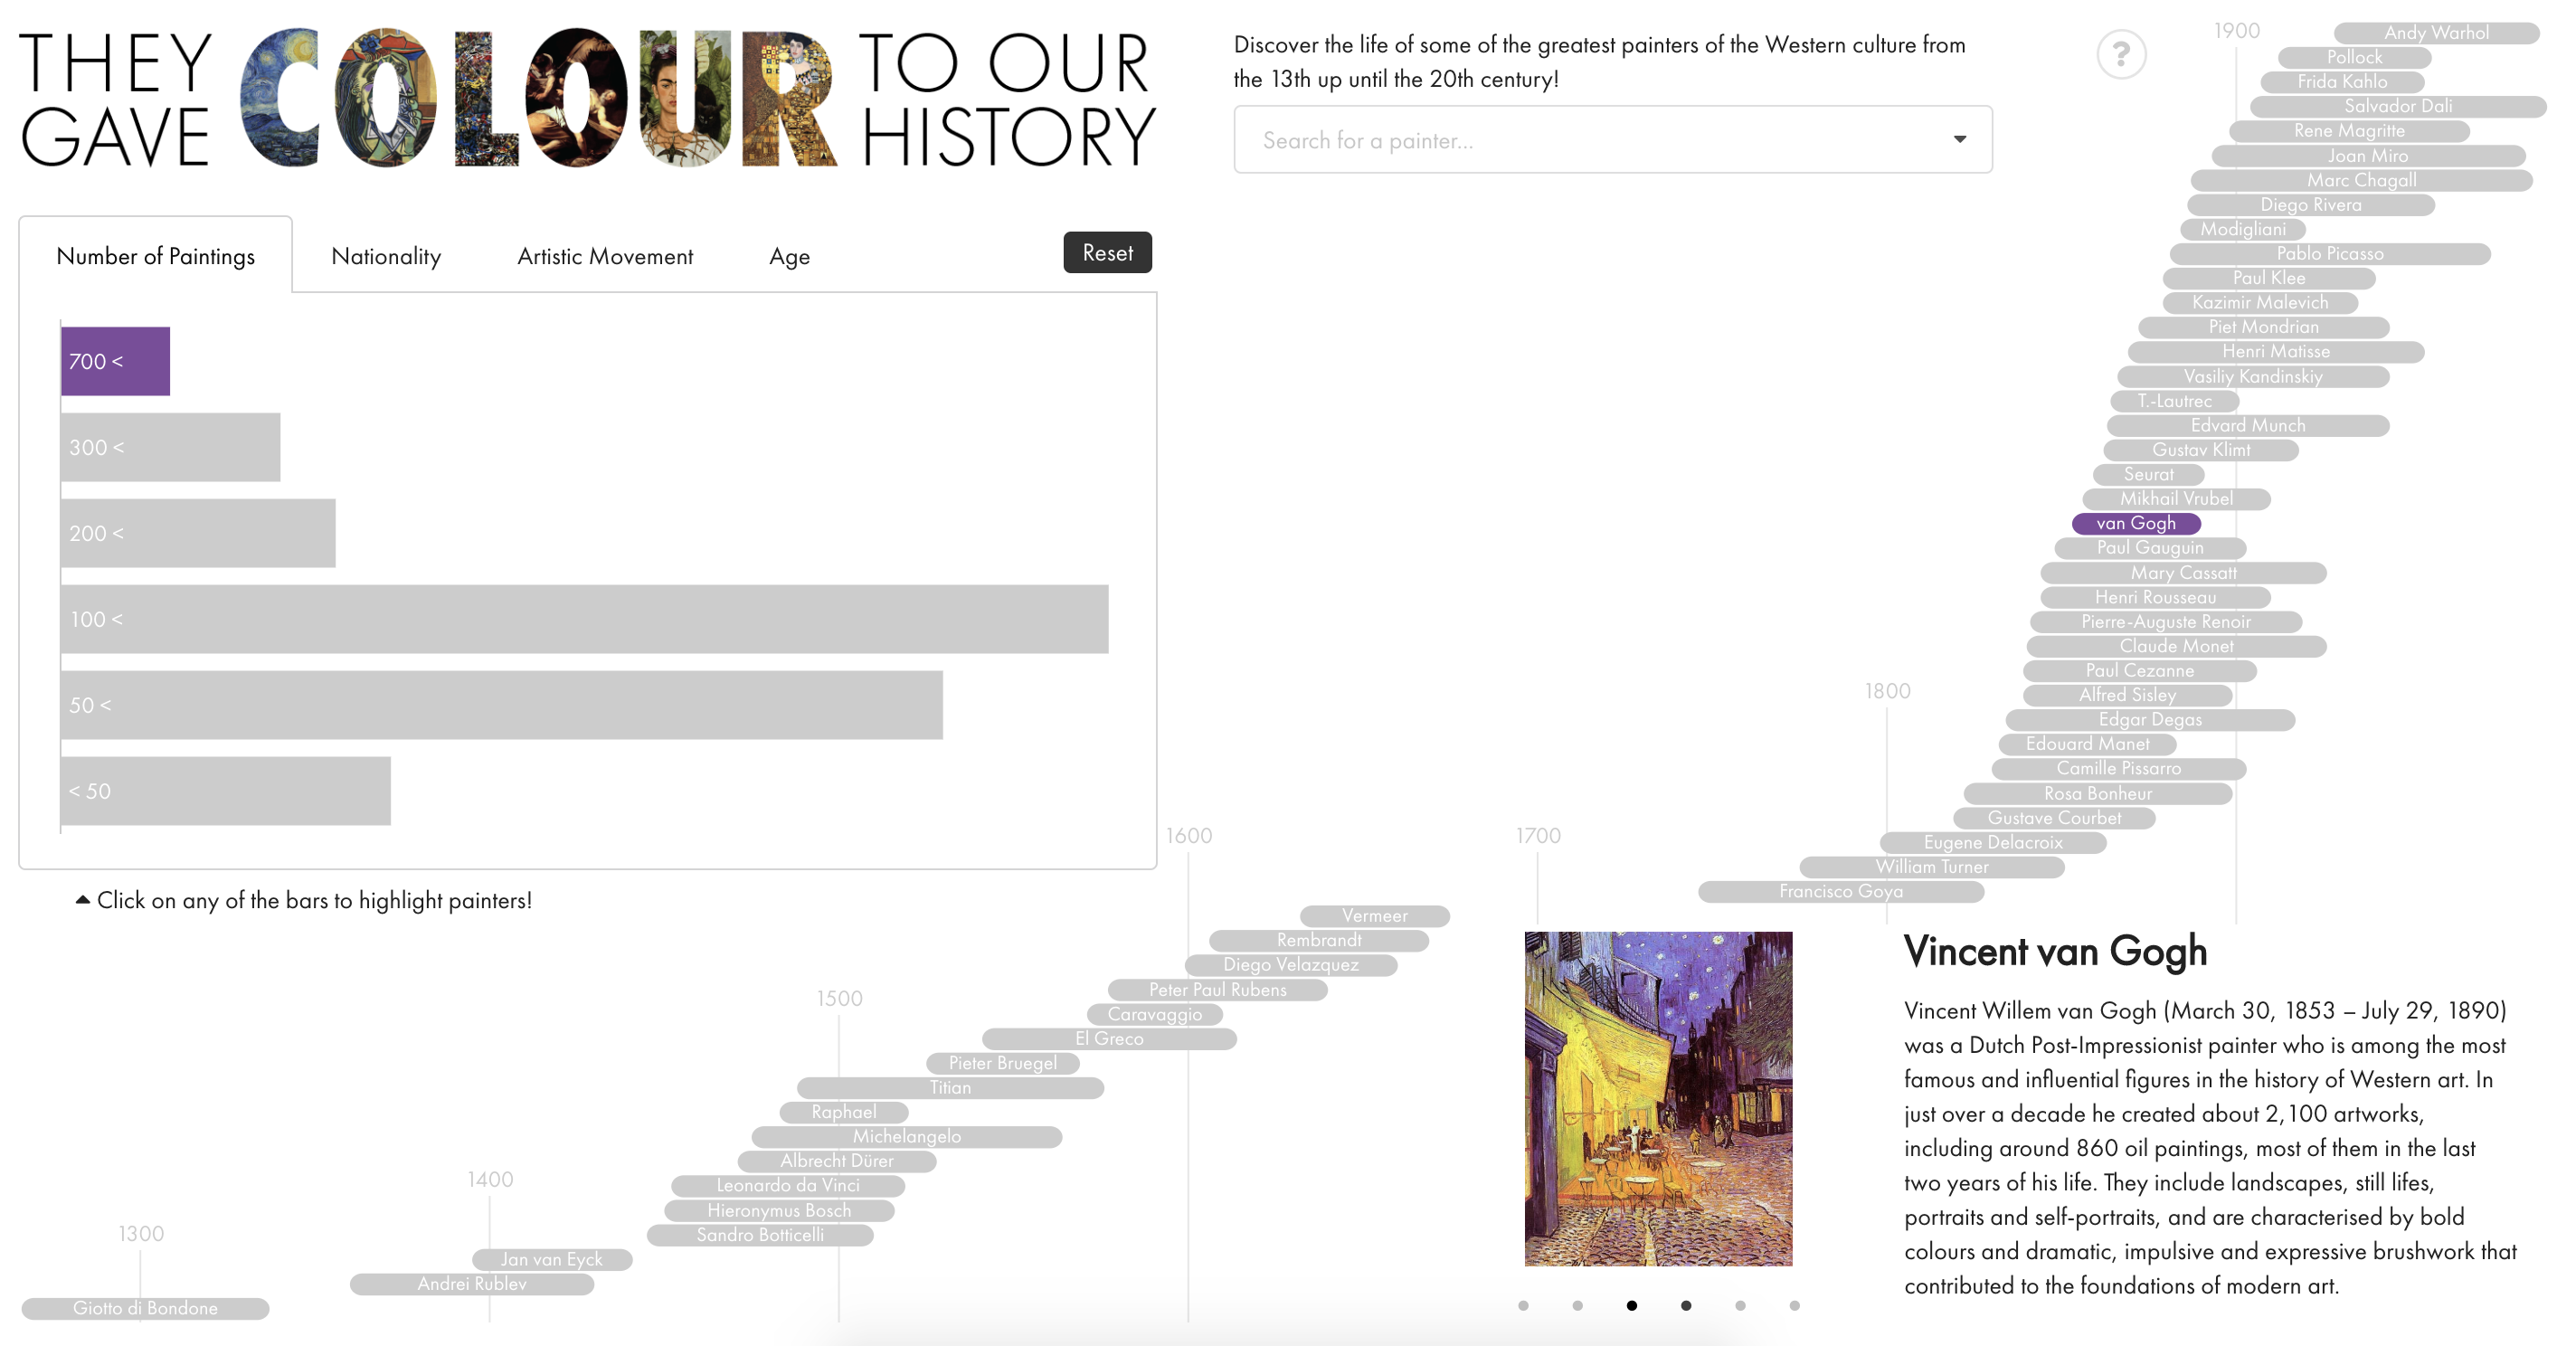
An own project providing you an overview you to discover the life and main chef d'ouvres of some of the most influential painters of our history starting from the 13th up until the 20th century.
Chart types
Gant Chart,
Horizontal Bar Chart
Libraries
d3.js,
React,
Semantic UI React,
React Carousel
Data sources
Kaggle - Best Artworks of All Time,
Wikipedia
Hi there!
Let me start with a quick introduction, my name is András Szesztai, currently residing in beautiful Netherlands - more specifically in cheeseful Gouda 🧀 -, but originally from lovely Hungary.
To sum up my career and education, I finished my master's in international relations, learned French and Russian on the way, and experienced the hospitality of Scotland and France for some time.
The meantime I fell in love with data visualisation by using Tableau and with the help of many many amazing people who I saw passionate about communicating complex data in some of the most beautiful, elegant and creative ways.
At the amazing company I currently work at, Newzoo, I got the chance to learn how to create engaging visualisations by combining the power of d3.js and React. So as of now, I do just that, both at work and in most of my spare time.
My mission is to somehow use my skillset for making our world a better place by helping organisations to communicate their data better to their audience. And here exactly where you might come into the picture.
If you are someone from a non-profit organization with data that you have been considering to make available for the broader public to inform people about and engage them with your cause, then do not hesitate to get in touch and let me be your data visualisation volunteer for a project or two!
